
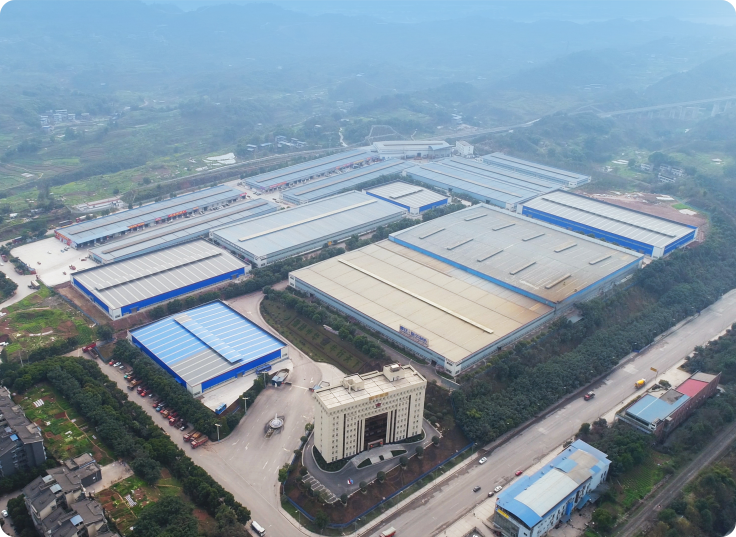
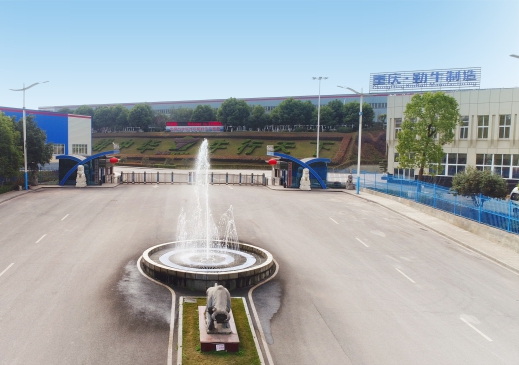
关于勤牛
About KinBull
科研产品介绍
Scientific Research Products
明星产品介绍
Star Products
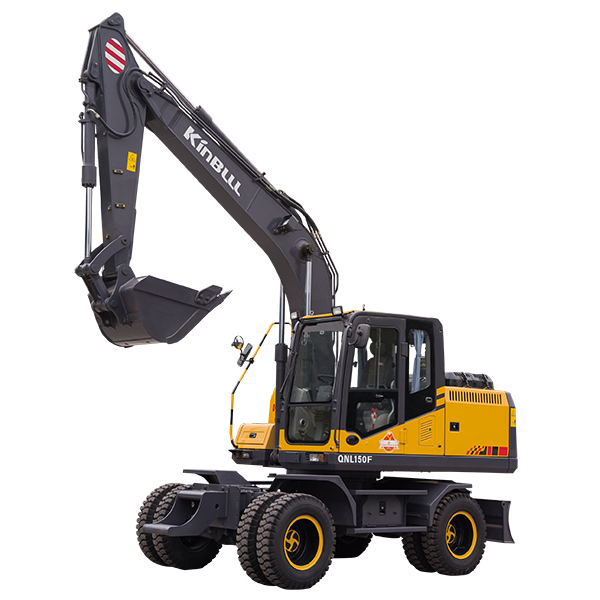
QNL150F 轮式挖掘机
产品概述:
QNL150F轮式挖掘机以其行走速度快、能远距离自行转场及可快速更换多种作业装置的机动、灵活、高效的特点,在机场、港口、油田、矿藏、城乡建设、农田水利、快速抢修等物料挖掘、搬移方面得到充分利用。...
产品特点:
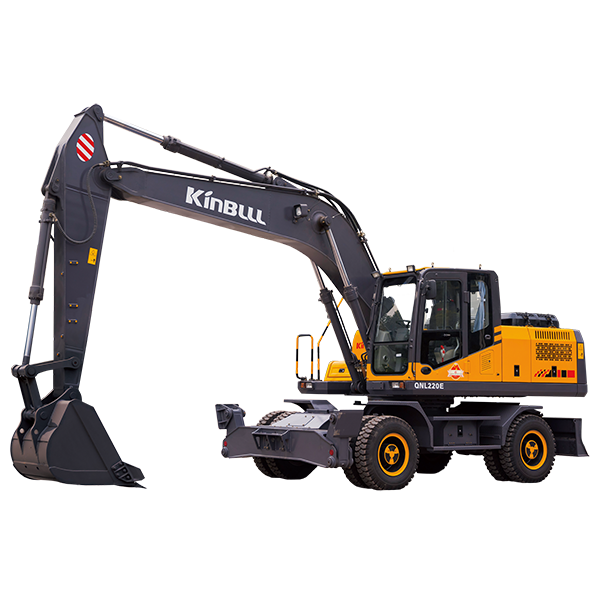
QNL220E 轮式挖掘机
产品概述:
QNL220E轮式挖掘机以其行走速度快、能远距离自行转场及可快速更换多种作业装置的机动、灵活、高效的特点,在机场、港口、油田、矿藏、城乡建设、农田水利、快速抢修等物料挖掘、搬移方面得到充分利用。...
产品特点:
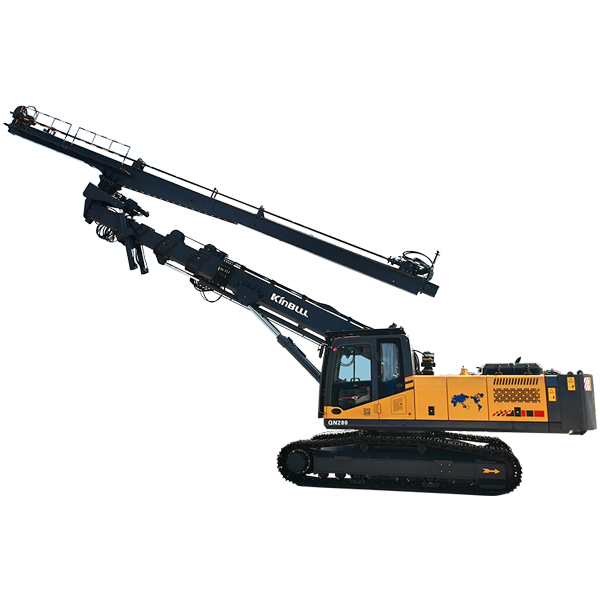
QN330 多功能锚杆钻机
产品概述:
产品特点:
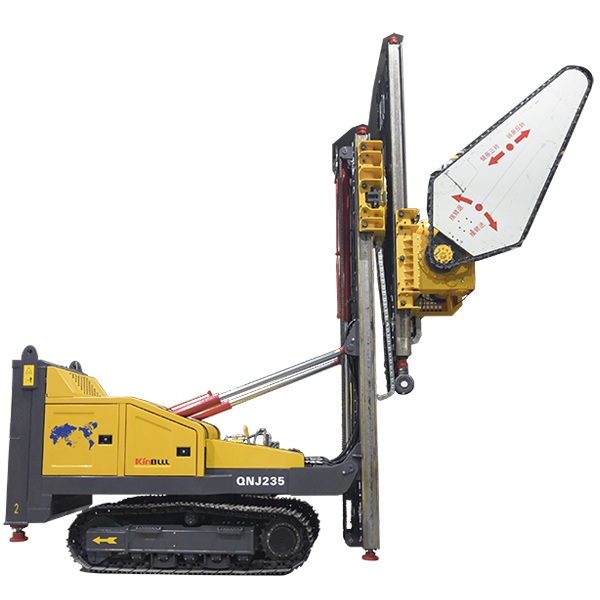
QNJ235 多功能洞采链臂锯
产品概述:
产品特点:
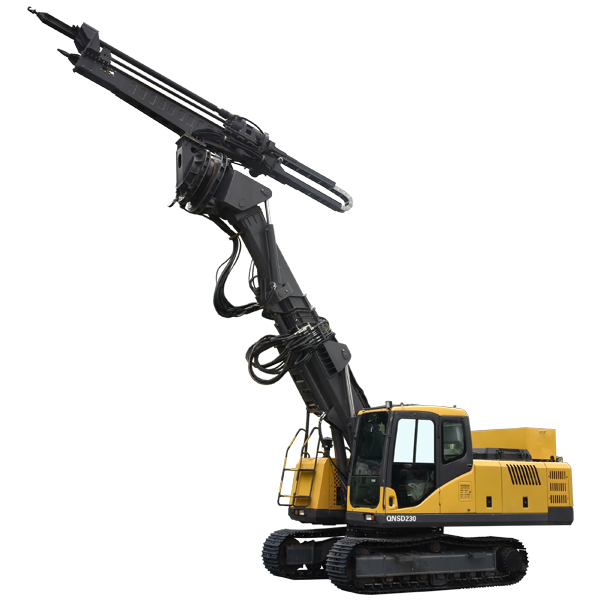
QNSD230 环保水除尘隧道掘进机
产品概述:
产品特点:
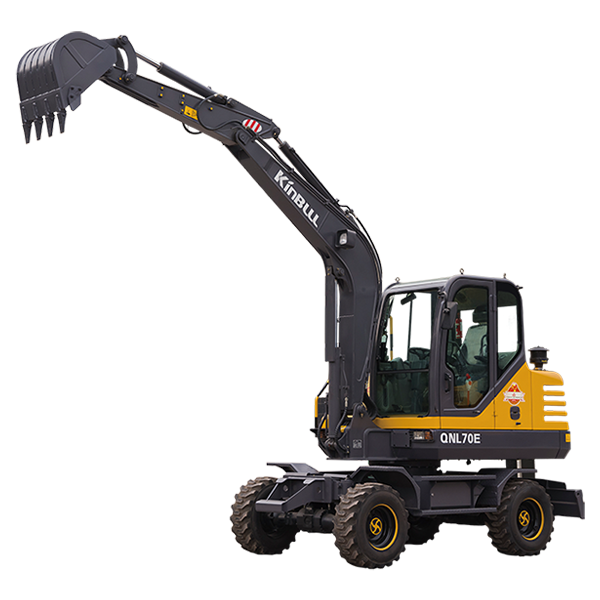
QNL70E 轮式挖掘机
产品概述:
产品特点:

新闻媒体
KinBull News
2022
11/20
11/20
10月挖掘机销量观察:国三库存出清提振,连续4...